Favorability Ratings and A Republican Senate Primary on the Horizon
Favorabilities/Re-elect vs replace/Paxton-Cornyn Primary
Hey y’all, welcome back! Today, we’re diving back into the findings from TPOR’s recent poll on 2025 state legislative issues in Texas and the 2026 Senate race. Today, we’re looking at the favorability ratings of key national and Texas political figures and voter views on Senator John Cornyn’s 2026 re-election bid, including how he might fare in a matchup with Attorney General Ken Paxton.
Here are some of the key takeaways:
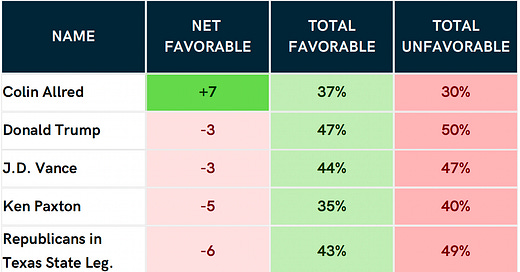
Trump’s favorability rating is -3—a 15-point drop from November, when it was +12; Abbott also experienced a significant post-election decline in favorability, from +5 to -13.
At -22, Cornyn’s favorability is the lowest of elected official, political figure, or group of elected officials tested; Paxton’s favorability is at -5.
Only 13% of voters say they would vote to re-elect Cornyn, including just 22% of Republicans; 49% of Republicans say they would consider another candidate or that they want to replace him.
Asked about a hypothetical Republican primary matchup between Cornyn and Paxton, 38% of Republicans say they would vote for Paxton while 27% say they would vote for Cornyn.
Favorability: Key Political Figures
President Donald Trump is viewed favorably by 47% of Texas voters and unfavorably by 50%, putting his net favorability at -3. This is a significant decline since November, when Trump’s net favorability was +12 (55% favorable, 43% unfavorable). Additionally, the share of voters who view him “very” favorably dropped from 42% to 37%, and the share of Republican and independent voters who view him favorably dropped from 96% to 89% and from 49% to 24%, respectively. Overall, this represents the first time TPOR's polling has registered Trump's favorability rating as net negative.
Governor Greg Abbott’s net favorability also experienced a post-election decline. In November, 50% of voters viewed him favorably and 45% viewed him unfavorably (net favorability +5). In the latest poll, 41% of voters viewed him favorably, while 54% viewed him unfavorably, giving him a net favorability rating of -13. The share of Republican and independent voters who view him favorably declined from 89% and 45% to 77% and 21%, respectively.
Elon Musk—who is based in Texas and plays a key role in the Trump administration—has a net favorability rating of -10, with 43% of voters viewing him favorably and 53% viewing him unfavorably.
Of the political figures surveyed, Colin Allred has the highest net favorability, at +7 (37% favorable, 30% unfavorable). But despite having been on the ballot in November, one-third of voters have never heard of him or have no opinion of him.
However, from August to March, Attorney General Ken Paxton's favorability rating improved from 32% favorable and 45% unfavorable (net favorable -13) to 35% favorable and 40% unfavorable (net favorable -5). Still, he remains underwater by five points.
The least popular elected official, political figure, or group of politicians tested is Senator John Cornyn; just 21% view him favorably and 43% view him unfavorably (net favorable -22). 29% of Republicans view Cornyn favorably, while 64% view Paxton favorably.
2026 Senate Race: Cornyn’s Re-election Prospects
Looking ahead to Cornyn’s November 2026 Senate re-election bid: 13% of voters say they would vote to re-elect him, 27% say they would consider someone else, 36% say they want to replace him, and 24% say they don’t know or refused to answer.
Notably, just 22% of Republican voters say that they would vote to re-elect Cornyn, while 49% of these voters say they would consider someone else (26%) or want to replace him (23%). And only 7% of independent voters say they would vote to re-elect Cornyn (a share similar to that of Democrats who say the same); 24% say they would consider someone else, and 36% say they want to replace him.
Meanwhile, when asked who they would vote for in a hypothetical Republican primary matchup between Cornyn and Ken Paxton (who is now officially running), 38% of Republican voters say Paxton and 27% say Cornyn, with 35% either undecided (16%), selecting “other” (7%), refusing to answer (4%), or not planning to vote in that race (8%).
Thanks for reading today’s post! Stay tuned for more polling and analysis from TPOR, and if you found this post useful, please share with friends and family, and most importantly, subscribe for free!


